
A Guide to Affordability in Vancouver
Explore what it means to live and work in our region
Please note that all dollar amounts in this guide are expressed in Canadian currency (CAD).
Note: This page was published in 2020 and will be updated again in 2024.

Owning a Home in Vancouver
What to expect when purchasing a home in the region
Property Price by Neighbourhood
| Municipality | Property Price
 The data presented is for the properties in 25th percentile which reflects properties that provide move-in-ready accommodation (i.e. they are not tear-downs and don't require substantial renovation).
|
More | |
|---|---|---|---|
| Vancouver West | $2,442,000 |
 50th: $3,080,000
75th: $4,060,000 |
|
| Vancouver East | $1,310,000 |
50th: $1,536,500 75th: $1,778,000 |
|
| Vancouver Downtown | n/a** |
50th: n/a** 75th: n/a** |
|
| Burnaby | $1,240,500 |
50th: $1,429,500 75th: $1,730,000 |
|
| New Westminster | $1,021,500 |
50th: $1,202,000 75th: $1,372,500 |
|
| North Vancouver | $1,425,000 |
50th: $1,630,000 75th: $2,027000 |
|
| West Vancouver | $2,180,000 |
50th: $2,800,000 75th: $3,820,000 |
|
| Richmond | $1,380,000 |
50th: $1,657,500 75th: $1,188,000 |
|
| Surrey | $875,000 |
50th: $1,050,000 75th: $1,250,000 |
|
| Langley | $830,323 |
50th: $1,276,900 75th: $1,572,500 |
|
| Coquitlam | $1,065,750 |
50th: $950,000 75th: $1,080,000 |
|
| Port Coquitlam | $870,500 |
50th: $1,375,000 75th: $1,639,000 |
|
| Port Moody | $1,164,500 |
50th: $xx 75th: $xx |
| Municipality | Household Income
Household Income Required: the annual household income that a bank would require for the mortgage to be approved (assuming a Gross Service Ratio of 32%)
|
More | Monthy Cash Expenses
Cash Expense: the total of the monthly mortgage payment (principal & interest), utilities, property tax, and strata fees (if applicable). The calculation assumes a 20% down payment.
|
More | Monthly Economic Cost
Economic Cost: measures the true cost of ownership (not just the cash expense) in which the expected future appreciation of the property reduces the cost of ownership. It is calculated using the following formula:
Mortgage Interest Payment + Opportunity Cost of Downpayment + Property Taxes + Maintenance & Depreciation - Expected Capital Gains |
More |
|---|---|---|---|---|---|---|
| Vancouver West | $325,643 |
50th: $409,007 75th: $537,057 |
$8,684 |
50th: $10,907 75th: $14,322 |
$3,835 |
50th:$4,837 75th:$6,376 |
| Vancouver East | $177,732 |
50th:$207,327 75th:$238,883 |
$4,740 |
50th:$5,529 75th:$6,370 |
$2,057 |
50th:$2,413 75th:$2,792 |
| Vancouver Downtown | n/a** |
50th: n/a** 75th: n/a** |
n/a** |
50th:n/a** 75th:n/a** |
n/a** |
50th:n/a** 75th:n/a** |
| Burnaby | $169,638 |
50th:$194,484 75th:$233,988 |
$4,524 |
50th:$5,186 75th:$6,240 |
$1,975 |
50th:$2,275 75th:$2,754 |
| New Westminster | $144,681 |
50th:$169,087 75th:$192,140 |
$3,858 |
50th:$4,509 75th:$5,124 |
$1,728 |
50th:$2,033 75th:$2,322 |
| North Vancouver | $194,235 |
50th:$221,234 75th:$273,519 |
$5,180 |
50th:$5,900 75th:$7,294 |
$2,277 |
50th:$2,605 75th:$3,239 |
| West Vancouver | $291,424 |
50th:$372,440 75th:$505,723 |
$7,771 |
50th:$9,932 75th:$13,486 |
$3,424 |
50th:$4,398 75th:$6,000 |
| Richmond | $188,569 |
50th:$225,168 75th:$295,135 |
$5,029 |
50th:$6,004 75th:$7,870 |
$2,212 |
50th:$2,657 75th:$3,508 |
| Surrey | $122,345 |
50th:$145,502 75th:$183,412 |
$3,263 |
50th:$3,880 75th:$4,891 |
$1,413 |
50th:$1,695 75th:$2,158 |
| Langley | $118,072 |
50th:$140,188 75th:$174,434 |
$3,149 |
50th:$3,738 75th:$4,652 |
$1,384 |
50th:$1,659 75th:$2,084 |
| Coquitlam | $148,959 |
50th:$177,171 75th:$216,667 |
$3,972 |
50th:$4,725 75th:$5,778 |
$1,758 |
50th:$2,106 75th:$2,593 |
| Port Coquitlam | $122,880 |
50th:$133,502 75th:$150,873 |
$3,277 |
50th:$3,560 75th:$4,023 |
$1,436 |
50th:$1,567 75th:$1,781 |
| Port Moody | $163,423 |
50th:$191,778 75th:$227,340 |
$4,358 |
50th:$5,144 75th:$6,062 |
$1,954 |
50th:$2,307 75th:$2,751 |
*Properties below the 25th percentile price point (i.e. the 25-percent lowest-priced properties on the market) may require significant remodelling or renovation before being suitable for accommodation.
**Data not available as there are limited single family dwellings in Downtown Vancouver.
Source: Property Price - BC Assessment 2018
Property Price for Townhouses
| Municipality | Property Price
The data presented is for the properties in 25th percentile which reflects properties that provide move-in-ready accommodation (i.e. they are not tear-downs and don't require substantial renovation).
|
More | |
|---|---|---|---|
| Vancouver West | $998,000 |
50th:$1,288,000 75th:$1,650,000 |
|
| Vancouver East | $820,000 |
50th:$955,000 75th:$1,150,000 |
|
| Vancouver Downtown | $1,107,500 |
50th:$1,367,500 75th:$1,862,500 |
|
| Burnaby | $600,000 |
50th:$730,000 75th:$840,000 |
|
| New Westminster | $632,500 |
50th:$732,500 75th:$805,000 |
|
| North Vancouver | $850,000 |
50th:$960,000 75th:$1,092,000 |
|
| West Vancouver | $1,260,000 |
50th:$1,739,500 75th:$2,069,000 |
|
| Richmond | $745,000 |
50th:$855,000 75th:$998,000 |
|
| Surrey | $540,000 |
50th:$610,000 75th:$678,650 |
|
| Langley | $521,700 |
50th:$582,500 75th:$644,950 |
|
| Coquitlam | $680,000 |
50th:$780,000 75th:$890,000 |
|
| Port Coquitlam | $605,000 |
50th:$680,000 75th:$775,000 |
|
| Port Moody | $640,000 |
50th:$760,000 75th:$891,000 |
| Municipality | Household Income
Household Income Required: the annual household income that a bank would require for the mortgage to be approved (assuming a Gross Service Ratio of 32%)
|
More | Monthy Cash Expenses
Cash Expense: the total of the monthly mortgage payment (principal & interest), utilities, property tax, and strata fees (if applicable). The calculation assumes a 20% down payment.
|
More | Monthly Economic Cost
Economic Cost: measures the true cost of ownership (not just the cash expense) in which the expected future appreciation of the property reduces the cost of ownership. It is calculated using the following formula: Mortgage Interest Payment + Opportunity Cost of Downpayment + Property Taxes + Strata Fee - Expected Capital Gains |
More |
|---|---|---|---|---|---|---|
| Vancouver West | $153,607 |
50th: $191,500 75th:$238,800 |
$4,096 |
50th: $5,107 75th:$6,368 |
$1,179 |
50th: $1,393 75th:$1,660 |
| Vancouver East | $127,885 |
50th: $145,525 75th:$171,004 |
$3,410 |
50th: $3,881 75th:$4,560 |
$983 |
50th: $1,082 75th:$1,226 |
| Vancouver Downtown | $172,339 |
50th: $206,311 75th:$270,990 |
$4,596 |
50th: $5,502 75th:$7,226 |
$1,378 |
50th: $1,570 75th:$1,935 |
| Burnaby | $97,732 |
50th: $114,822 75th:$129,282 |
$2,606 |
50th: $3,062 75th:$3,448 |
$783 |
50th: $881 75th:$965 |
| New Westminster | $101,317 |
50th: $114,838 75th:$124,641 |
$2,702 |
50th: $3,062 75th:$3,324 |
$789 |
50th: $875 75th:$937 |
| North Vancouver | $131,251 |
50th: $145,738 75th:$163,123 |
$3,500 |
50th: $3,886 75th:$4,350 |
$990 |
50th: $1,074 75th:$1,175 |
| West Vancouver | $193,701 |
50th: $256,357 75th:$299,413 |
$5,165 |
50th: $6,836 75th:$7,984 |
$1,529 |
50th: $1,882 75th:$2,125 |
| Richmond | $116,520 |
50th: $131,027 75th:$149,887 |
$3,107 |
50th: $3,494 75th:$3,997 |
$886 |
50th: $970 75th:$1,080 |
| Surrey | $88,342 |
50th: $97,605 75th:$106,689 |
$2,356 |
50th: $2,603 75th:$2,845 |
$697 |
50th: $752 75th:$806 |
| Langley | $87,871 |
50th: $96,036 75th:$104,423 |
$2,343 |
50th: $2,561 75th:$2,785 |
$735 |
50th: $786 75th:$838 |
| Coquitlam | $110,712 |
50th: $124,073 75th:$138,771 |
$2,952 |
50th: $3,309 75th:$3,701 |
$909 |
50th: $991 75th:$1,081 |
| Port Coquitlam | $95,779 |
50th: $105,801 75th:$118,495 |
$2,554 |
50th: $2,821 75th:$3,160 |
$717 |
50th: $778 75th:$856 |
| Port Moody | $103,926 |
50th: $120,091 75th:$137,737 |
$2,771 |
50th: $3,202 75th:$3,673 |
$838 |
50th: $940 75th:$1,050 |
*Properties below the 25th percentile price point (i.e. the 25-percent lowest-priced properties on the market) may require significant remodelling or renovation before being suitable for accommodation.
Sources: Property Price - BC Assessment 2018, Strata Fees - Real Estate Board of Greater Vancouver, Fraser Valley Real Estate Board, 2018
Property Price for 2 Bedroom Condos
| Municipality | Property Price
The data presented is for the properties in 25th percentile which reflects properties that provide move-in-ready accommodation (i.e. they are not tear-downs and don't require substantial renovation).
|
More | |
|---|---|---|---|
| Vancouver West | $799,000 |
50th:$906,000 75th:$1,115,900 |
|
| Vancouver East | $618,000 |
50th:$735,000 75th:$970,000 |
|
| Vancouver Downtown | $870,000 |
50th:$1,075,000 75th:$1,410,000 |
|
| Burnaby | $530,000 |
50th:$625,000 75th:$722,450 |
|
| New Westminster | $467,500 |
50th:$545,000 75th:$620,000 |
|
| North Vancouver | $606,000 |
50th:$720,000 75th:$825,500 |
|
| West Vancouver | $835,000 |
50th:$1,100,000 75th:$1,565,000 |
|
| Richmond | $506,000 |
50th:$608,000 75th:$684,000 |
|
| Surrey | $395,000 |
50th:$428,000 75th:$480,000 |
|
| Langley | $415,000 |
50th:$452,950 75th:$529,500 |
|
| Coquitlam | $500,000 |
50th:$590,000 75th:$635,000 |
|
| Port Coquitlam | $425,000 |
50th:$465,000 75th:$518,000 |
|
| Port Moody | $535,000 |
50th:$599,000 75th:$692,000 |
| Municipality | Household Income
Household Income Required: the annual household income that a bank would require for the mortgage to be approved (assuming a Gross Service Ratio of 32%)
|
More | Monthy Cash Expenses
Cash Expense: the total of the monthly mortgage payment (principal & interest), utilities, property tax, and strata fees (if applicable). The calculation assumes a 20% down payment.
|
More | Monthly Economic Cost
Economic Cost: measures the true cost of ownership (not just the cash expense) in which the expected future appreciation of the property reduces the cost of ownership. It is calculated using the following formula: Mortgage Interest Payment + Opportunity Cost of Downpayment + Property Taxes + Strata Fee - Expected Capital Gains |
More |
|---|---|---|---|---|---|---|
| Vancouver West | $127,291 |
50th:$141,273 75th: $168,699 |
$3,394 |
50th:$3,767 75th: $4,499 |
$1,024 |
50th:$1,103 75th: $1,258 |
| Vancouver East | $101,674 |
50th:$116,962 75th: $147,668 |
$2,711 |
50th:$3,119 75th: $3,938 |
$839 |
50th:$925 75th: $1,098 |
| Vancouver Downtown | $143,340 |
50th:$170,126 75th: $213,898 |
$3,822 |
50th:$4,537 75th: $5,704 |
$1,257 |
50th:$1,408 75th: $1,655 |
| Burnaby | $89,705 |
50th:$102,194 75th: $115,005 |
$2,392 |
50th:$2,725 75th: $3,067 |
$761 |
50th:$833 75th: $907 |
| New Westminster | $85,743 |
50th:$96,222 75th: $106,363 |
$2,286 |
50th:$2,566 75th: $2,836 |
$827 |
50th:$894 75th: $958 |
| North Vancouver | $103,076 |
50th:$118,090 75th: $131,984 |
$2,749 |
50th:$3,149 75th: $3,520 |
$909 |
50th:$996 75th: $1,077 |
| West Vancouver | $142,250 |
50th:$176,878 75th: $237,639 |
$3,793 |
50th:$4,717 75th: $6,337 |
$1,324 |
50th:$1,520 75th: $1,863 |
| Richmond | $87,266 |
50th:$100,719 75th: $110,742 |
$2,327 |
50th:$2,686 75th: $2,953 |
$762 |
50th:$841 75th: $899 |
| Surrey | $71,077 |
50th:$75,444 75th: $82,324 |
$1,895 |
50th:$2,012 75th: $2,195 |
$635 |
50th:$661 75th: $702 |
| Langley | $72,620 |
50th:$77,716 75th: $87,997 |
$1,937 |
50th:$2,072 75th: $2,347 |
$621 |
50th:$653 75th: $717 |
| Coquitlam | $86,010 |
50th:$98,035 75th: $104,047 |
$2,294 |
50th:$2,614 75th: $2,775 |
$745 |
50th:$818 75th: $855 |
| Port Coquitlam | $73,259 |
50th:$78,604 75th: $85,686 |
$1,954 |
50th:$2,096 75th: $2,285 |
$611 |
50th:$644 75th: $687 |
| Port Moody | $92,484 |
50th:$101,105 75th: $113,633 |
$2,466 |
50th:$2,696 75th: $3,030 |
$821 |
50th:$876 75th: $954 |
*Properties below the 25th percentile price point (i.e. the 25-percent lowest-priced properties on the market) may require significant remodelling or renovation before being suitable for accommodation.
Sources: Property Price - BC Assessment 2018, Strata Fees - Real Estate Board of Greater Vancouver, Fraser Valley Real Estate Board, 2018
Property Price for 1 Bedroom Condos
| Municipality | Property Price
The data presented is for the properties in 25th percentile which reflects properties that provide move-in-ready accommodation (i.e. they are not tear-downs and don't require substantial renovation).
|
More | |
|---|---|---|---|
| Vancouver West | $536,000 |
50th:$610,000 75th:$683,000 |
|
| Vancouver East | $488,000 |
50th:$543,000 75th:$658,800 |
|
| Vancouver Downtown | $600,000 |
50th:$664,000 75th:$740,000 |
|
| Burnaby | $418,000 |
50th:$487,833 75th:$558,000 |
|
| New Westminster | $365,000 |
50th:$412,000 75th:$479,000 |
|
| North Vancouver | $455,000 |
50th:$513,000 75th:$553,000 |
|
| West Vancouver | $541,000 |
50th:$630,000 75th:$764,000 |
|
| Richmond | $375,400 |
50th:$434,000 75th:$510,000 |
|
| Surrey | $316,000 |
50th:$349,000 75th:$375,000 |
|
| Langley | $321,000 |
50th:$359,000 75th:$400,000 |
|
| Coquitlam | $380,000 |
50th:$430,000 75th:$485,000 |
|
| Port Coquitlam | $340,000 |
50th:$382,000 75th:$410,000 |
|
| Port Moody | $429,000 |
50th:$468,000 75th:$505,000 |
| Municipality | Household Income
Household Income Required: the annual household income that a bank would require for the mortgage to be approved (assuming a Gross Service Ratio of 32%)
|
More | Monthy Cash Expenses
Cash Expense: the total of the monthly mortgage payment (principal & interest), utilities, property tax, and strata fees (if applicable). The calculation assumes a 20% down payment.
|
More | Monthly Economic Cost
Economic Cost: measures the true cost of ownership (not just the cash expense) in which the expected future appreciation of the property reduces the cost of ownership. It is calculated using the following formula: Mortgage Interest Payment + Opportunity Cost of Downpayment + Property Taxes + Strata Fee - Expected Capital Gains |
More |
|---|---|---|---|---|---|---|
| Vancouver West | $87,716 |
50th: $97,385 75th: $106,924 |
$2,339 |
50th: $2,597 75th: $2,851 |
$692 |
50th: $746 75th: $800 |
| Vancouver East | $80,323 |
50th: $87,509 75th: $102,640 |
$2,142 |
50th: $2,334 75th: $2,737 |
$626 |
50th: $667 75th: $752 |
| Vancouver Downtown | $98,461 |
50th: $106,823 75th: $116,754 |
$2,626 |
50th: $2,849 75th: $3,113 |
$802 |
50th: $849 75th: $905 |
| Burnaby | $70,601 |
50th: $79,781 75th: $89,005 |
$1,883 |
50th: $2,127 75th: $2,373 |
$559 |
50th: $612 75th: $666 |
| New Westminster | $66,606 |
50th: $72,961 75th: $82,020 |
$1,776 |
50th: $1,946 75th: $2,187 |
$598 |
50th: $639 75th: $696 |
| North Vancouver | $78,649 |
50th: $86,288 75th: $91,556 |
$2,097 |
50th: $2,301 75th: $2,441 |
$672 |
50th: $717 75th: $747 |
| West Vancouver | $93,800 |
50th: $105,430 75th: $122,940 |
$2,501 |
50th: $2,811 75th: $3,278 |
$840 |
50th: $906 75th: $1,005 |
| Richmond | $66,124 |
50th: $73,852 75th: $83,876 |
$1,763 |
50th: $1,969 75th: $2,237 |
$557 |
50th: $602 75th: $661 |
| Surrey | $57,161 |
50th: $61,528 75th: $64,968 |
$1,524 |
50th: $1,641 75th: $1,732 |
$481 |
50th: $507 75th: $527 |
| Langley | $57,260 |
50th: $62,363 75th: $67,869 |
$1,527 |
50th: $1,663 75th: $1,810 |
$470 |
50th: $502 75th: $536 |
| Coquitlam | $66,081 |
50th: $72,761 75th: $80,110 |
$1,762 |
50th: $1,940 75th: $2,136 |
$543 |
50th: $584 75th: $629 |
| Port Coquitlam | $59,959 |
50th: $65,571 75th: $69,312 |
$1,599 |
50th: $1,749 75th: $1,848 |
$490 |
50th: $524 75th: $547 |
| Port Moody | $72,382 |
50th: $77,636 75th: $82,620 |
$1,930 |
50th: $2,070 75th: $2,203 |
$577 |
50th: $610 75th: $641 |
*Properties below the 25th percentile price point (i.e. the 25-percent lowest-priced properties on the market) may require significant remodelling or renovation before being suitable for accommodation.
Sources: Property Price - BC Assessment 2018, Strata Fees - Real Estate Board of Greater Vancouver, Fraser Valley Real Estate Board, 2018
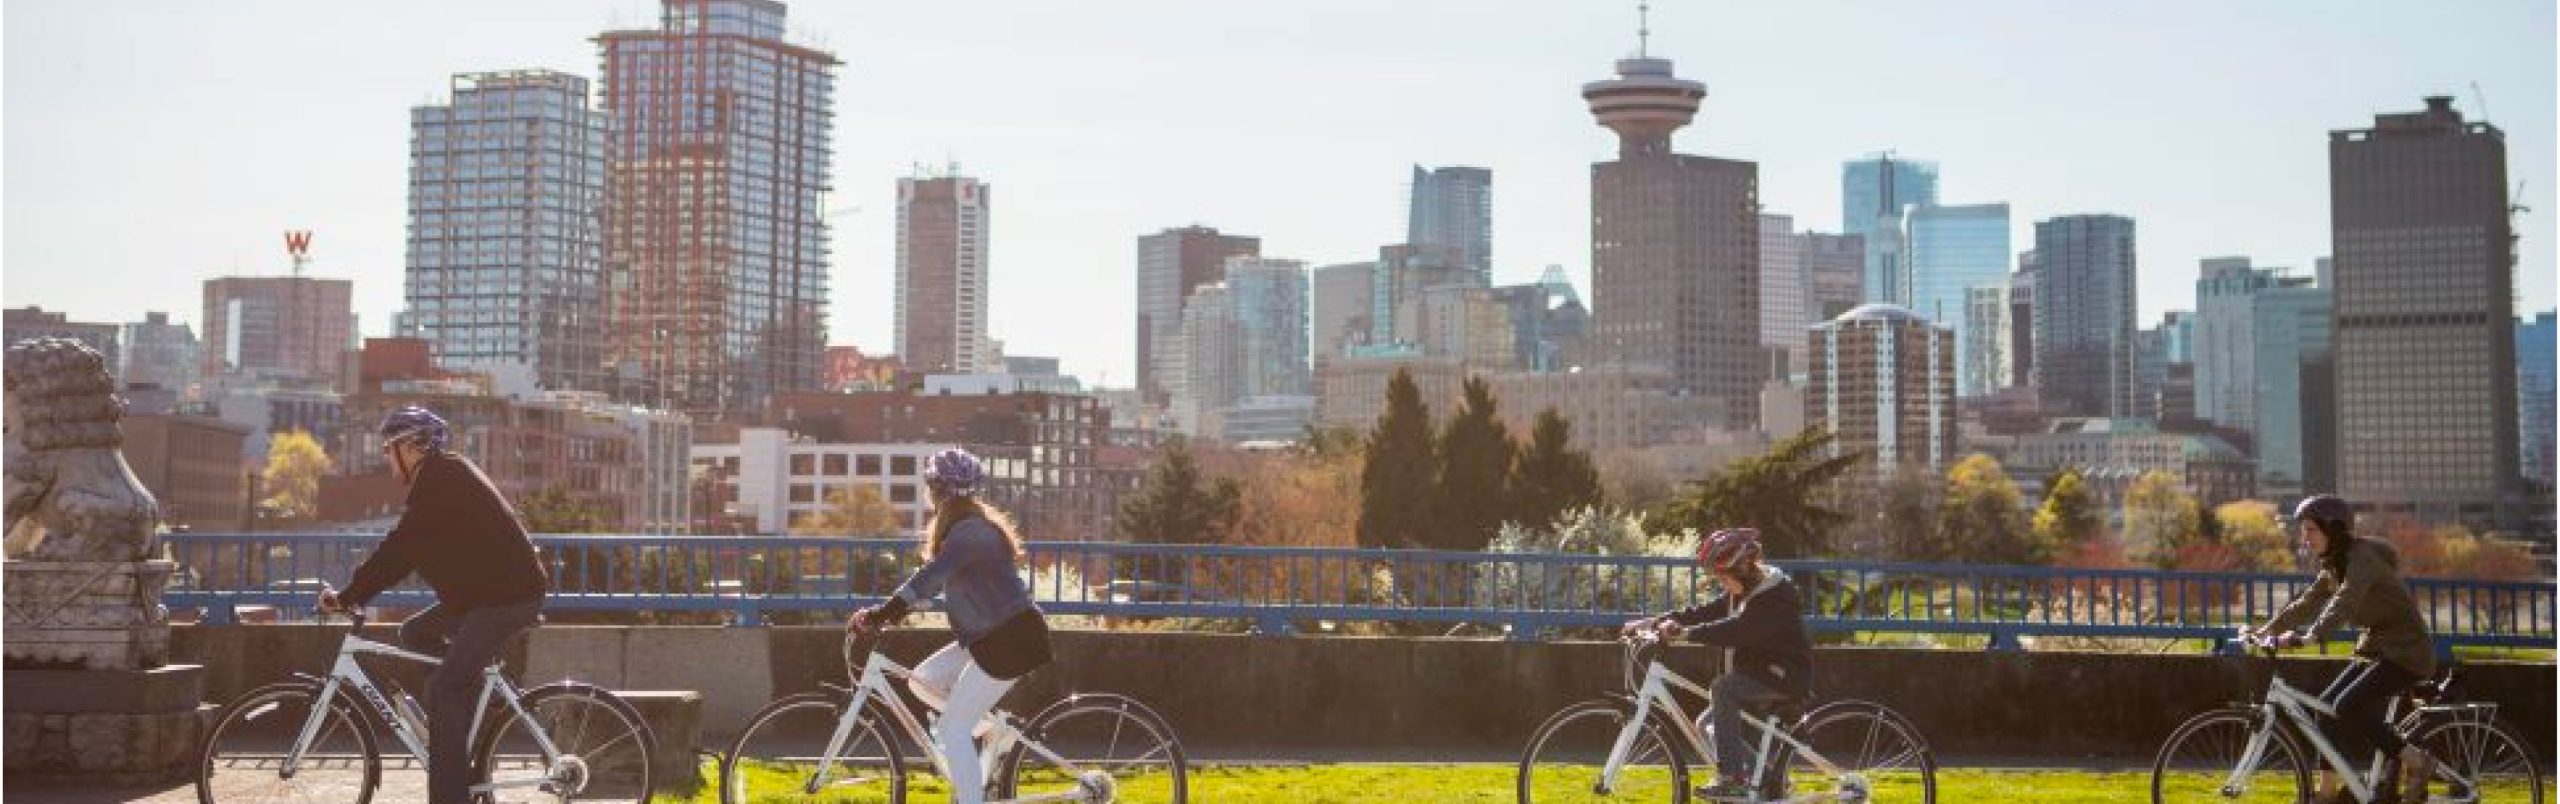
Renting a Home in Vancouver
What to expect when researching the rental market for your new home
Average Rent for 1 Bedroom Units
| Municipality | Vacant | Occupied | |
|---|---|---|---|
| City of Vancouver (all neighbourhoods) | $1,705 | $1,490 | |
| West End/Stanley Park | $1,814 | $1,562 | |
| English Bay | $1,838 | $1,665 | |
| Downtown | $1,816 | $1,678 | |
| South Granville/Oak | $1,708 | $1,491 | |
| Kitsilano/Point Grey | $1,847 | $1,574 | |
| Westside/Kerrisdale | $1,600 | $1,484 | |
| Marpole | $1,198 | $1,155 | |
| Mount Pleasant/Renfrew Heights | $1,684 | $1,294 | |
| East Hastings | $1,590 | $1,242 | |
| Southeast Vancouver | $1,711 | $1,302 | |
| Burnaby | $1,551 | $1,213 | |
| New Westminster | $1,340 | $1,193 | |
| North Vancouver | $1,614 | $1,467 | |
| West Vancouver | $1,901 | $1,751 | |
| Richmond | $1,384 | $1,249 | |
| Surrey | $1,295 | $1,018 | |
| Langley | $1,403 | $1,207 | |
| Tri-Cities (Coquitlam/Port Coquitlam/Port Moody) |
$1,140 | $1,145 |
** Data suppressed to protect confidentiality or data not statistically reliable *Privately Initiated Apartments, 3 Units and Over *Census Metropolitan Areas Source: Canada Mortgage and Housing Corporation (CMHC) 2019 Rental Market Survey
Average Rent for 2 Bedroom Units
| Municipality | Vacant | Occupied | |
|---|---|---|---|
| City of Vancouver (all neighbourhoods) | $2,466 | $2,062 | |
| West End/Stanley Park | ** | $2,286 | |
| English Bay | $2,571 | $2,337 | |
| Downtown | $2,762 | $2,542 | |
| South Granville/Oak | $2,172 | $2,015 | |
| Kitsilano/Point Grey | $2,666 | $2,135 | |
| Westside/Kerrisdale | $3,134 | $2,297 | |
| Marpole | $2,125 | $1,529 | |
| Mount Pleasant/Renfrew Heights | $2,216 | $1,777 | |
| East Hastings | ** | $1,656 | |
| Southeast Vancouver | $2,444 | $1,845 | |
| Burnaby | $1,927 | $1,544 | |
| New Westminster | $2,083 | $1,584 | |
| North Vancouver | $2,319 | $1,832 | |
| West Vancouver | $2,946 | $2,578 | |
| Richmond | $1,629 | $1,507 | |
| Surrey | ** | $1,213 | |
| Langley | $1,857 | $1,550 | |
| Tri-Cities (Coquitlam/Port Coquitlam/Port Moody) |
$2,176 | $1,499 |
** Data suppressed to protect confidentiality or data not statistically reliable *Privately Initiated Apartments, 3 Units and Over *Census Metropolitan Areas Source: Canada Mortgage and Housing Corporation (CMHC) 2019 Rental Market Survey
Average Rent for 3+ Bedroom Units
| Municipality | Vacant | Occupied | |
|---|---|---|---|
| City of Vancouver (all neighbourhoods) | ** | $2,526 | |
| West End/Stanley Park | ** | $3,508 | |
| English Bay | ** | ** | |
| Downtown | ** | $3,700 | |
| South Granville/Oak | ** | $2,577 | |
| Kitsilano/Point Grey | ** | $2,801 | |
| Westside/Kerrisdale | ** | $3,114 | |
| Marpole | ** | $1,610 | |
| Mount Pleasant/Renfrew Heights | ** | ** | |
| East Hastings | ** | $1,762 | |
| Southeast Vancouver | ** | $2,080 | |
| Burnaby | $2,435 | $1,765 | |
| New Westminster | ** | $1,967 | |
| North Vancouver | ** | $2,244 | |
| West Vancouver | $3,566 | $3,753 | |
| Richmond | ** | $1,791 | |
| Surrey | ** | $1,346 | |
| Langley | ** | $2,104 | |
| Tri-Cities (Coquitlam/Port Coquitlam/Port Moody) |
** | $1,455 |
** Data suppressed to protect confidentiality or data not statistically reliable *Privately Initiated Apartments, 3 Units and Over *Census Metropolitan Areas Source: Canada Mortgage and Housing Corporation (CMHC) 2019 Rental Market Survey
Average Rent for Bachelor Units
| Municipality | Vacant | Occupied | |
|---|---|---|---|
| City of Vancouver (all neighbourhoods) | $1,351 | $1,274 | |
| West End/Stanley Park | ** | $1,285 | |
| English Bay | $1,474 | $1,329 | |
| Downtown | $1,198 | $1,362 | |
| South Granville/Oak | ** | $1,201 | |
| Kitsilano/Point Grey | $1,248 | $1,276 | |
| Westside/Kerrisdale | ** | $1,154 | |
| Marpole | ** | $1,114 | |
| Mount Pleasant/Renfrew Heights | $1,364 | $1,246 | |
| East Hastings | $1,558 | $1,292 | |
| Southeast Vancouver | ** | $1,097 | |
| Burnaby | $1,239 | $1,014 | |
| New Westminster | ** | $1,092 | |
| North Vancouver | ** | $1,221 | |
| West Vancouver | ** | $1,412 | |
| Richmond | ** | $1,056 | |
| Surrey | ** | $898 | |
| Langley | ** | $901 | |
| Tri-Cities (Coquitlam/Port Coquitlam/Port Moody) |
** | $930 |
** Data suppressed to protect confidentiality or data not statistically reliable *Privately Initiated Apartments, 3 Units and Over *Census Metropolitan Areas Source: Canada Mortgage and Housing Corporation (CMHC) 2019 Rental Market Survey
Child Care Options
A range of support choices for young and growing families
Licensed Group Child Care
At licensed group child care the child care takes place at a community-based facility or centre. Licensed child care facilities are monitored and regularly inspected by regional health authorities.
Child Care Fee Reduction Initiative
The BC Child Care Fee Reduction Initiative (CCFRI) provides funding to make child care more affordable for families across the province. Funding is available to eligible, licensed child care organizations to reduce monthly child care fees.
The BC Child Care Fee Reduction Initiative (CCFRI) provides funding to make child care more affordable for families across the province. Funding is available to eligible, licensed child care organizations to reduce monthly child care fees.
- $350/month for Group infant/toddler care (Under 36 months)
- $200/month for Family infant/toddler care (Under 36 months)
- $100/month for Group care for children aged 3 years to Kindergarten
- $60/month for Family care for children aged 3 years to Kindergarten
- Helpful Links for Child Care Fee Reduction: BC Child Opportunity Benefit, Affordable Child Care Benefit, and the Child Care Fee Reduction Initiative (CCFRI).
| Child Care Fee Reduction Initiative
The BC Child Care Fee Reduction Initiative (CCFRI) provides funding to make child care more affordable for families. Funding is available to eligible, licensed child care organizations to reduce monthly child care fees.
|
|---|
|
Helpful Links for Child Care Fee Reduction: BC Child Opportunity Benefit, Affordable Child Care Benefit, and the Child Care Fee Reduction Initiative (CCFRI).
Average Monthly Child Care Fees
All rates reported are total fees without consideration of the Child Care Fee Reduction Initiative (CCFRI). Fees may not include add-ons like food programs and some administration fees.
All rates reported are total fees without consideration of the Child Care Fee Reduction Initiative (CCFRI). Fees may not include add-ons like food programs and some administration fees.
| Licensed Group Child Care | ||||
|---|---|---|---|---|
| Infant (0-18mths) |
Toddler (18mths-3yrs) |
3-5yrs | School Age (6-12yrs)
Before & after school
|
|
| Vancouver | $1,525 | $1,462 | $1,034 | $390 |
| Burnaby | $1,151 | $1,105 | $879 | $401 |
| New Westminster | $1,134 | $1,029 | $825 | $395 |
| North Shore | $1,480 | $1,390 | $1,045 | $547 |
| Richmond | $1,346 | $1,234 | $1,006 | $458 |
| Surrey | $1,347 | $1,184 | $939 | $525 |
| Langley | $1,145 | $1,145 | $841 | $475 |
| Coquitlam | $1,039 | $1,029 | $811 | $438 |
| Port Coquitlam | $976 | $958 | $735 | $393 |
| Port Moody | $950 | $872 | $767 | $425 |
Data Source: Fee Surveys from Metro Vancouver Child Care Resource and Referral Centres
Licensed Family & In-Home Multi-Age Care
In licensed family & in-home multi-age child care the child care takes place in the child care provider's own home. Licensed child care facilities are monitored and regularly inspected by regional health authorities.
Child Care Fee Reduction Initiative
The BC Child Care Fee Reduction Initiative (CCFRI) provides funding to make child care more affordable for families across the province. Funding is available to eligible, licensed child care organizations to reduce monthly child care fees.
The BC Child Care Fee Reduction Initiative (CCFRI) provides funding to make child care more affordable for families across the province. Funding is available to eligible, licensed child care organizations to reduce monthly child care fees.
- $350/month for Group infant/toddler care (Under 36 months)
- $200/month for Family infant/toddler care (Under 36 months)
- $100/month for Group care for children aged 3 years to Kindergarten
- $60/month for Family care for children aged 3 years to Kindergarten
- Helpful Links for Child Care Fee Reduction: BC Child Opportunity Benefit, Affordable Child Care Benefit, and the Child Care Fee Reduction Initiative (CCFRI).
| Child Care Fee Reduction Initiative
The BC Child Care Fee Reduction Initiative (CCFRI) provides funding to make child care more affordable for families across the province. Funding is available to eligible, licensed child care organizations to reduce monthly child care fees.
|
|---|
|
Helpful Links for Child Care Fee Reduction: BC Child Opportunity Benefit, Affordable Child Care Benefit, and the Child Care Fee Reduction Initiative (CCFRI).
Average Monthly Child Care Fees
All rates reported are total fees without consideration of the Child Care Fee Reduction Initiative (CCFRI). Fees may not include add-ons like food programs and some administration fees.
All rates reported are total fees without consideration of the Child Care Fee Reduction Initiative (CCFRI). Fees may not include add-ons like food programs and some administration fees.
| Licensed Family & In-Home Multi-Age Child Care | ||||
|---|---|---|---|---|
| Infant (0-18mths) |
Toddler (18mths-3yrs) |
3-5yrs | School Age (6-12yrs)
Before & after school
|
|
| Vancouver | $1,476 | $1,425 | $1,300 | $621 |
| Burnaby | $947 | $919 | $828 | $462 |
| New Westminster | $889 | $830 | $757 | $378 |
| North Shore | $1,350 | $1,300 | $1,129 | n/a |
| Richmond | $1,041 | $1,058 | $906 | $465 |
| Surrey | $873 | $839 | $817 | $474 |
| Langley | $948 | $948 | $852 | $463 |
| Coquitlam | $947 | $903 | $842 | $518 |
| Port Coquitlam | $876 | $858 | $777 | $456 |
| Port Moody | $922 | $883 | $786 | $399 |
Data Source: Fee Surveys from Metro Vancouver Child Care Resource and Referral Centres conducted between 2018-2020
Registered License-Not-Required (RLNR) Child Care
In RLNR, child care providers are unlicensed but have registered with a Child Care Resource and Referral Centre. Legally, the child care providers can care for up to two children (or a sibling group) who are not related to them.
Average Monthly Child Care Fees
All rates reported are total fees without consideration of the Child Care Fee Reduction Initiative (CCFRI). Fees may not include add-ons like food programs and some administration fees.
All rates reported are total fees without consideration of the Child Care Fee Reduction Initiative (CCFRI). Fees may not include add-ons like food programs and some administration fees.
| Registered License-Not-Required Child Care | ||||
|---|---|---|---|---|
| Infant (0-18mths) |
Toddler (18mths-3yrs) |
3-5yrs | School Age (6-12yrs)
Before & after school
|
|
| Vancouver | $1,435 | $1,395 | $1,379 | n/a |
| Burnaby | $947 | $919 | $828 | $462 |
| New Westminster | $889 | $830 | $757 | $378 |
| North Shore | $1,350 | $1,300 | $1,129 | n/a |
| Richmond | $1,041 | $1,058 | $906 | $465 |
| Surrey | $978 | $903 | $823 | $533 |
| Langley | $825 | $825 | $775 | $475 |
| Coquitlam | $947 | $903 | $842 | $518 |
| Port Coquitlam | $876 | $858 | $777 | $456 |
| Port Moody | $922 | $883 | $786 | $399 |
Source: Fee Surveys from Metro Vancouver Child Care Resource and Referral Centres conducted between 2018-2020
Nannies
This unlicensed care is when parents arrange for child care at home. Parents must decide how to screen and hire the child care provider who becomes their employee.
Average Hourly Rates for Nannies
All rates reported are total fees without consideration of the Child Care Fee Reduction Initiative (CCFRI). Fees may not include add-ons like food programs and some administration fees.
All rates reported are total fees without consideration of the Child Care Fee Reduction Initiative (CCFRI). Fees may not include add-ons like food programs and some administration fees.
| Nannies | ||||
|---|---|---|---|---|
| Approximate Wage Range (Gross) | Experience & Skill Level | |||
| $15-$18 per hour |
Limited child care experience Experience babysitting, after-school care, volunteering No ECE or education degree |
|||
| $19-$25 per hour |
5-10 years experience Working towards being a career nanny Finishing ECE or education degree |
|||
| $22-$26+ per hour |
10+ years experience (career nanny) Educational background Likely to stay with the family long term |
|||
All rates reported are total fees without consideration of the Child Care Fee Reduction Initiative (CCFRI). Fees may not include add-ons like food programs and some administration fees.
Source: Nannies on Call
For more information on the different types of child care, please refer to the Province of British Columbia.
For additional information on child care in Vancouver, please refer to the City of Vancouver.
Household Spending
Average monthly expenses for the average family living in the Metro Vancouver Area
Utilities
Water, fuel and electricity for principal accommodation
Telephone
Landlines, cell phone service, and telephone equipment
Internet
Internet access services
Television
TV and satellite radio services (including installation, service, and pay TV charges)

Groceries
| Food |
 Average monthly cost of a nutritious food basket for a reference family of 2.6 people across the the Greater Vancouver Area. Reference family is made up of a male and female (age 31-50), and a boy (4-8 years old). Average monthly cost of a nutritious food basket for a reference family of 2.6 people across the the Greater Vancouver Area. Reference family is made up of a male and female (age 31-50), and a boy (4-8 years old). | ||
|---|---|---|---|
| Greater Vancouver Area | |||
| Vancouver | $834 | ||
| Fraser North (Burnaby, New Westminster, Tri-Cities) | $752 | ||
| North Shore | $792 | ||
| Richmond | $746 | ||
| Fraser South (Langley, Surrey, Delta) | $755 | ||
Other Types of Food
Restaurants
Meals, snacks, and beverages purchased at restaurants
Alcohol
Purchased both in restaurants and stores
Sources: 2017 Statistics Canada Vancouver Survey of Household Spending and the 2017 BC CDC Food Costing Guide. Expenses have been adjusted for inflation.
Getting Around
Mapping options for public transit and private vehicle ownership
Public Transit
Bus, Seabus and Skytrain Fares
| Zones | Adult | Concession | |
|---|---|---|---|
| Monthly Pass (Compass Card) |
1 | $98 | N/A |
| 2 | $131 | N/A | |
| 3 | $177 | $56.00 | |
| Zones | Adult | Concession | |
| Single Fares (Stored Value on Compass Card) |
1 | $2.40 | $1.95 |
| 2 | $3.45 | $2.95 | |
| 3 | $4.50 | $3.95 |
Quick Links: Frequent Transit Map (including bus) and Trip Planner
West Coast Express Fares
| To or From Waterfront | To or From Other Stations | ||||
|---|---|---|---|---|---|
|
3 Zones:
Moody Centre, Coquitlam Central, Port Coquitlam |
4 Zones:
Pitt Meadows, Maple Meadows, Port Haney |
5 Zones:
Mission City |
1-2 Zones:
Travel within a single zone or between adjacent zones |
3 Zones:
3 Zone travel across WCE (e.g. Mission City to Moody Centre) |
|
| Monthly Pass | |||||
| Adult | $208 | $251 | $342.75 | $158.75 | $208 |
| Concession | $128.50 | $158.25 | $221.25 | $97 | $128.50 |
| Stored Value | |||||
| Adult One-Way | $6.35 | $7.75 | $10.50 | $4.90 | $6.35 |
| Concession One-Way | $3.70 | $4.80 | $6.45 | $2.90 | $3.70 |
Source: Translink, 2020
Personal Vehicles
ICBC Basic Car Insurance
| Driving Experience | Monthly Cost |
|---|---|
| 2 years | $202.08 |
| 5 years | $161.46 |
| 10-14 years | $129.17 |
| 15-34 years | $119.79 |
Source: ICBC, 2020
Income
What you may expect to earn in your chosen profession
Top-Level Management |
|
|
Director of Operations Director of Strategy Chief Executive Officer Senior VP Operations VP Product Development |
|
| Directors | VPs & Executives |
| $102,000 | $143,292 |
| (Toronto: $103,846) | (Toronto: $149,008) |
Accounting &
|
|
|
Accountant Analyst Underwriter Financial Planner Senior Analyst Finance Manager Bank Branch Manager |
|
| Entry to Experienced | Senior & Management |
| $55,242 | $74,843 |
| (Toronto: $54,996) | (Toronto: $77,940) |
Administrative & Clerical |
|
|
Executive Assistant Payroll Coordinator Customer Service Specialist Administrative Manager Inventory Manager Office Manager |
|
| Entry to Experienced | Senior & Management |
| $49,143 | $56,700 |
| (Toronto: $47,216) | (Toronto: $63,262) |
Architecture & Engineering |
|
|
Mechanical Engineer Health & Safety Coordinator Landscape Architect Engineering Program Manager Senior Project Engineer Architecture Project Manager |
|
| Entry to Experienced | Senior & Management |
| $61,338 | $98,885 |
| (Toronto: $60,691) | (Toronto: $89,755) |
Art &
|
|
|
Graphic Designer Animator Product Developer Senior Web Designer Art Director Creative Services Manager |
|
| Entry to Experienced | Senior & Management |
| $55,135 | $99,982 |
| (Toronto: $51,398) | (Toronto: $82,265) |
Business
|
|
|
Buyer Consultant Business Analyst Lease Administrator Senior Business Consultant Supply Chain Manager Purchasing Manager |
|
| Entry to Experienced | Senior & Management |
| $55,073 | $77,840 |
| (Toronto: $54,033) | (Toronto: $79,098) |
Education
|
|
|
Elementary School Teacher Registrar Education Coordinator Professor Elementary School Principal Education Program Director |
|
| Entry to Experienced | Senior & Management |
| $55,215 | $70,369 |
| (Toronto: $52,443) | (Toronto: $71,767) |
Healthcare
|
|
|
Dental Hygienist Paramedic Dietician Physiotherapist General Surgeon Veterinarian Chief of Staff |
|
| Entry to Experienced | Senior & Management |
| $65,000 | $127,064 |
| (Toronto: $62,108) | (Toronto: $128,205) |


Human
|
|
|
Benefits Administrator Compensation Analyst Software Trainer Talent Acquisition Manager Senior Recruiter Organizational Development Manager |
|
| Entry to Experienced | Senior & Management |
| $54,093 | $83,206 |
| (Toronto: $51,256) | (Toronto: $76,345) |
Information Technology |
|
|
Software Developer Network Administrator Systems Analyst Lead Software Engineer Technical Project Manager Software Development Manager |
|
| Entry to Experienced | Senior & Management |
| $63,707 | $86,469 |
| (Toronto: $65,793) | (Toronto: $88,311) |
Legal
|
|
|
Legal Assistant Paralegal Immigration Consultant Attorney/Lawyer General Counsel |
|
| Entry to Experienced | Senior & Management |
| $55,486 | $99,500 |
| (Toronto: $51,690) | (Toronto: $93,993) |
Marketing &
|
|
|
Communications Coordinator Media Buyer Brand Strategist Copywriter Public Relations Manager Senior Communications Manager Marketing Project Manager |
|
| Entry to Experienced | Senior & Management |
| $48,797 | $69,691 |
| (Toronto: $47,360) | (Toronto: $72,029) |
Sales
|
|
|
Account Manager Insurance Sales Agent Sales Support Specialist Sales Representative Real Estate Broker National Account Manager International Sales Manager Branch Sales Manager |
|
| Entry to Experienced | Senior & Management |
| $50,868 | $74,526 |
| (Toronto: $49,463) | (Toronto: $79,820) |
Science &
|
|
|
Environmental Scientist Research Analyst Hydrogeologist Clinical Research Associate Environmental Manager Research & Development Manager Physicist |
|
| Entry to Experienced | Senior & Management |
| $56,368 | $77,415 |
| (Toronto: $56,495) | (Toronto: $79,802) |
Learn more about working in Vancouver
Explore some of Vancouver’s key sectors
Technology Digital Entertainment Green Economy
Source: PayScale, data reported is based on the median
Income Tax Rates
The federal and provincial governments levy personal income taxes on individual residents, and taxpayers must file a return with the Canadian Revenue Agency (CRA) once a year. Income past a certain point is taxed at a different rate and applied on a cumulative basis.
Provincial Taxable Income Brackets
BC personal income tax rates apply to specific tax brackets. The tax brackets are indexed each year to the Consumer Price Index for B.C. (BC CPI). For the 2020 tax year, the tax brackets were increased from the previous year by a BC CPI rate of 2.5%.
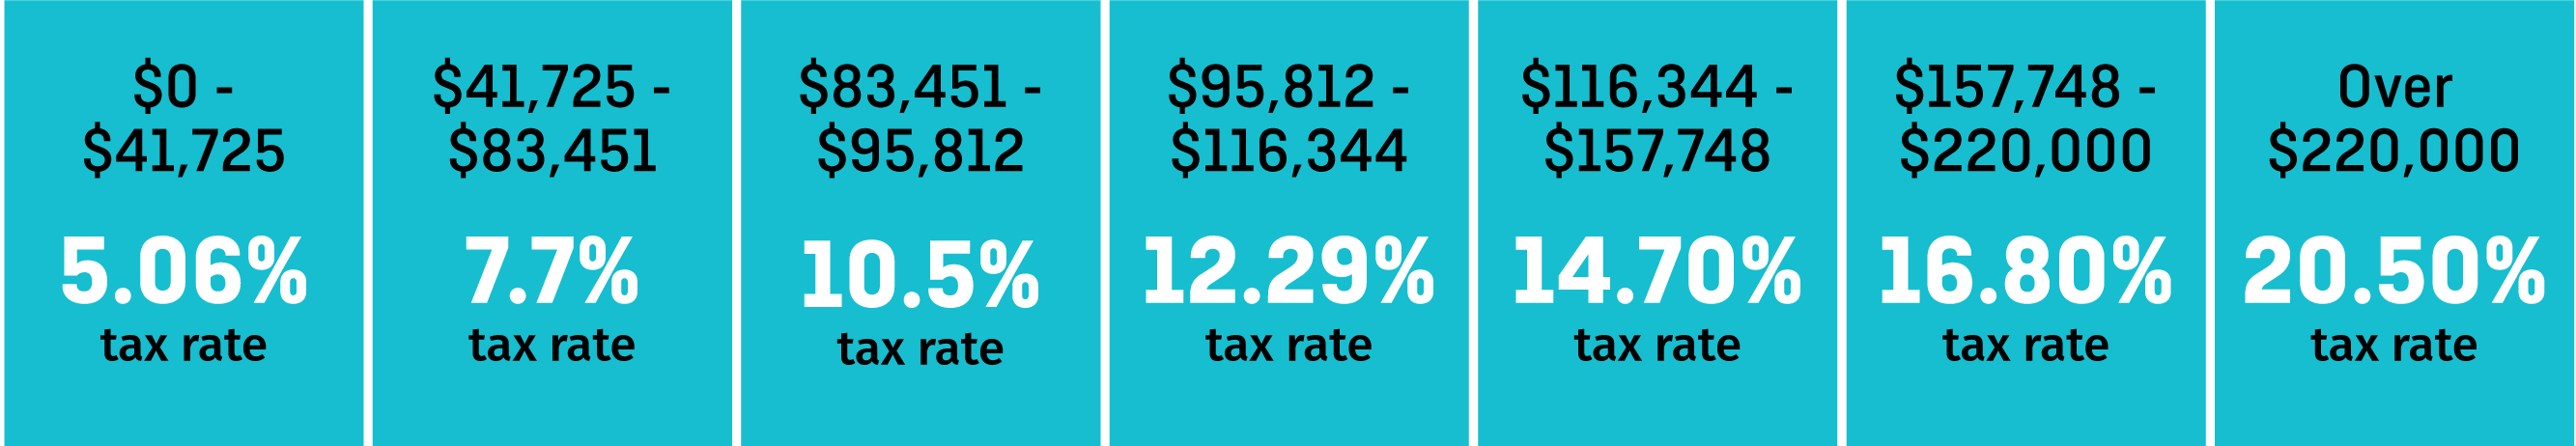
Source: Government of British Columbia
Federal Taxable Income Brackets
Canadian Federal income tax rates for individuals, 2020 tax year
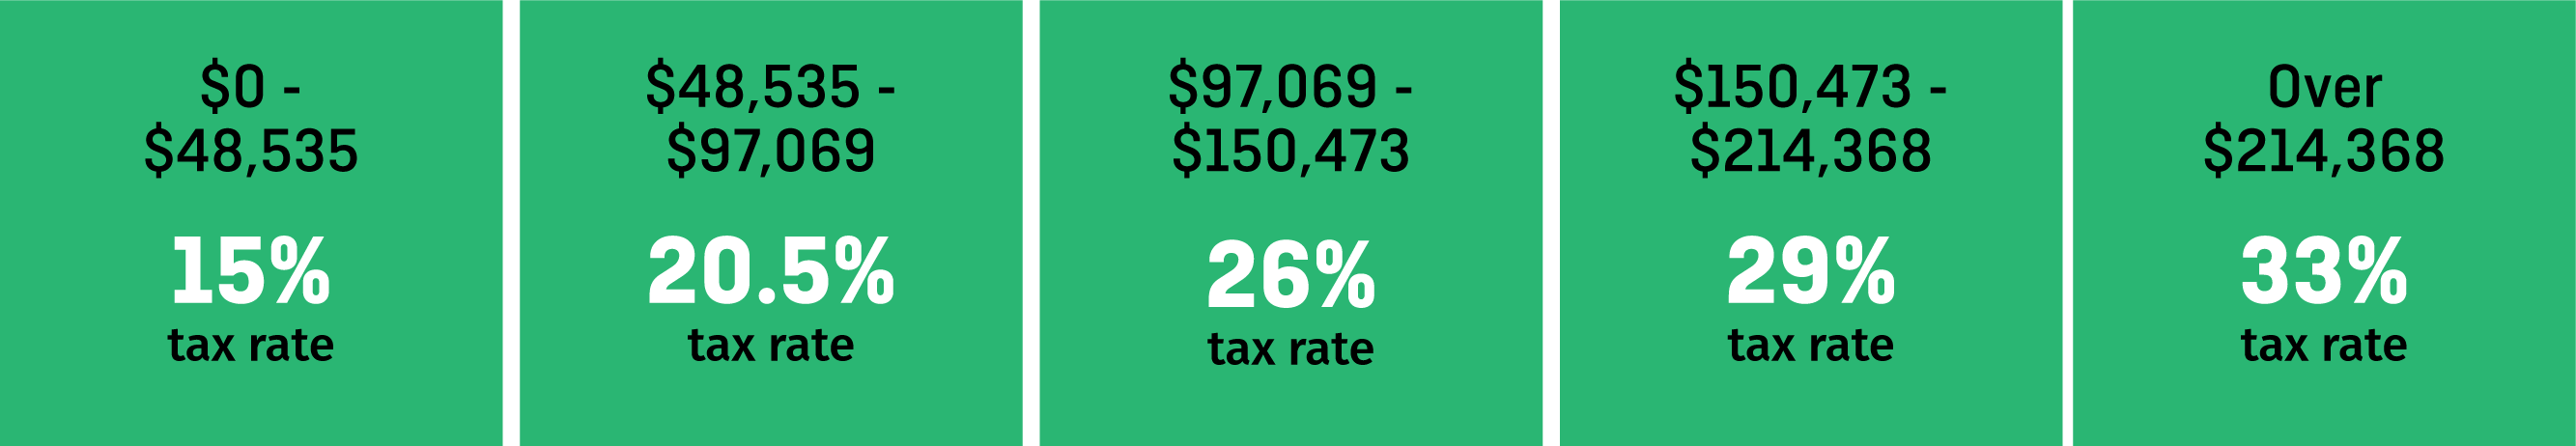
Source: Government of Canada